How To Make Them A Great Visual Asset For Your Brand
What’s an infographic? Consider the following definitions:
A chart, diagram, or illustration that uses graphic elements to present information in a visually striking way.
A chart, graph, or other image accompanied by minimal text, intended to give an easily understood overview, often of a complex subject.
Infographics are the chocolate chip cookies of the internet. (They go down easy– or at least they should.)
Visually striking, minimal text, easily understood, enjoyable.
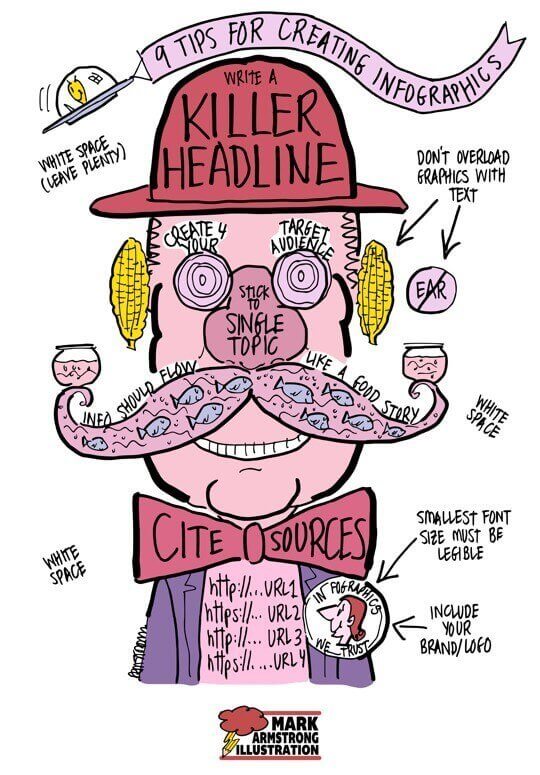
Building on those elements, I came up with 9 tips for creating a infographic. Here they are– in an infographic:
Here are the 9 tips teaching you how to create a good infographic
(Listed roughly in top-to-bottom order.)
Data visualization expert J. Ford Huffman:
“… the text and the image must reinforce each other. Each must show or tell what
the other cannot… Few readers want to read more than they have to read… My hunch is that if a graphic is text heavy, its visual isn’t doing its job well, and/or the writer didn’t know when to stop writing.”![]()
![]()
![]()
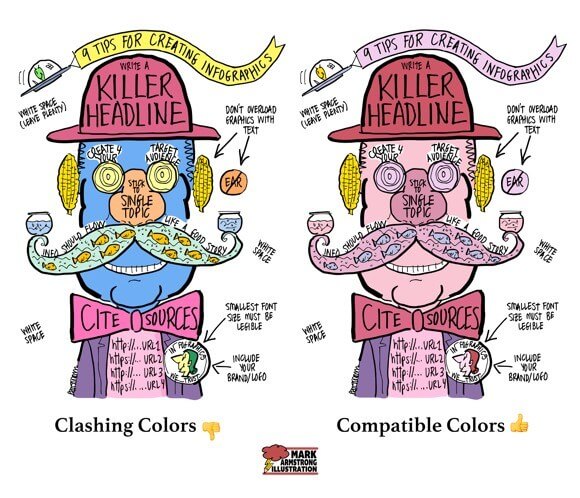
One bonus tip
Limit your palette, i.e., don’t use too many colors, and make sure the colors you do use are compatible with each other. You want your infographic to be visually striking, yes, but you also want it to be harmonious– and that means easy on the eye.
Hopefully this answers the question: How to create a good infographic?
Infographics have a surprising history. They go back further than you might think.
They also come in an astounding array of shapes, sizes, formats, and designs. Many are absolutely unique.
You can see what Creative Bloq calls The 60 Best Infographics here. I’d have to disagree, however. They’re all visually striking– no argument there– but a lot of them seem overly busy, text-heavy, and crammed with too much information– just my opinion. Take a look and see what you think.
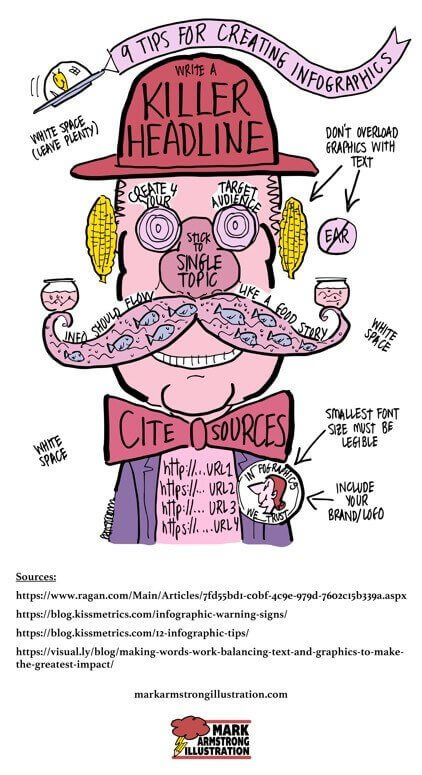
Here’s a bigger version of my own infographic, minus the sources: