Reporting for your marketing and sales processes is essential.
It’s not only working for us as a marketing agency, but it’s doing wonders for our clients. While we could go on and on about all of HubSpot’s features and how they’ve contributed to sales and marketing growth, this post focuses on one aspect alone — the sales and marketing dashboard.
Last week we addressed how to assemble a monthly Marketing Report. We spelled out what to include and how it can look. These reports are for those interested in marketing tactics and performance details.
Now the Monthly Sales Report
This week we’re looking at how to create a monthly Marketing & Sales KPI Report. It’s not granular like the Marketing Report; rather it’s top level. It’s intended for those who care about the big picture and includes all marketing venues and sales KPIs (Key Performance Indicators — measured to track progress toward specific business goals), ROI (Return on Investment) stats, business metrics, and financial goals.
Below is what our customized HubSpot CRM dashboard includes. It is, in essence, the perfect Marketing & Sales KPI Report. It’s everything a GM or owner wants to know.
NOTE: Don’t get caught up in the numbers below; these are formatting examples only.
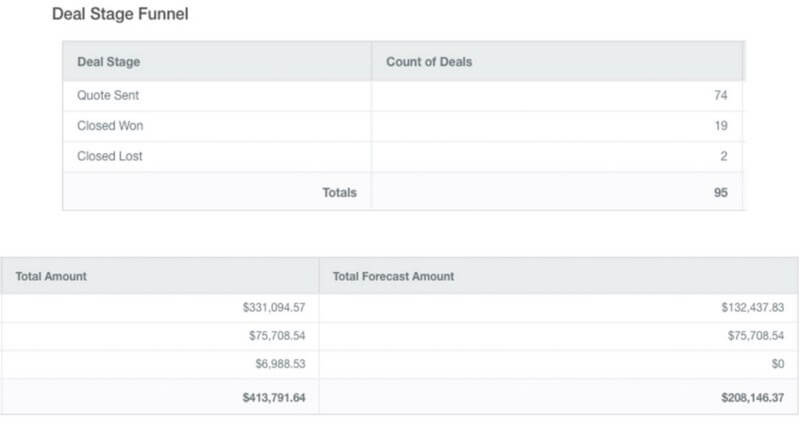
Deal Stage Funnel
This chart shows the progress of the deals being worked on as well as a forecast should the deals close.

Marketing Performance
This exhibits how marketing is fairing regarding website traffic, lead generation, and customer acquisition.

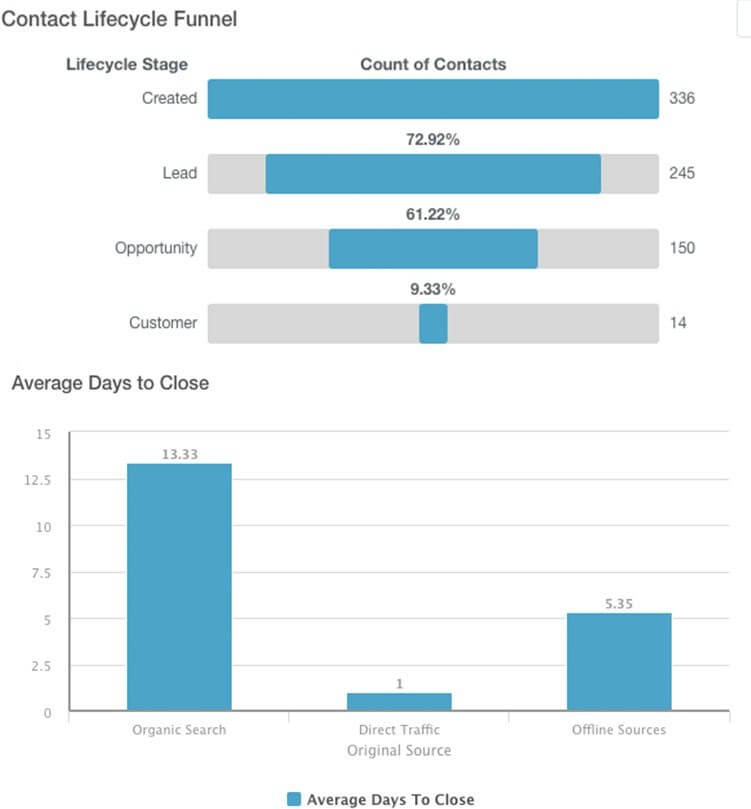
Contact Lifecycle Funnel and Average Days to Close
Here you can keep an eye on how many people are in what stage of the sales cycle, plus see how long it takes for new customers to close.

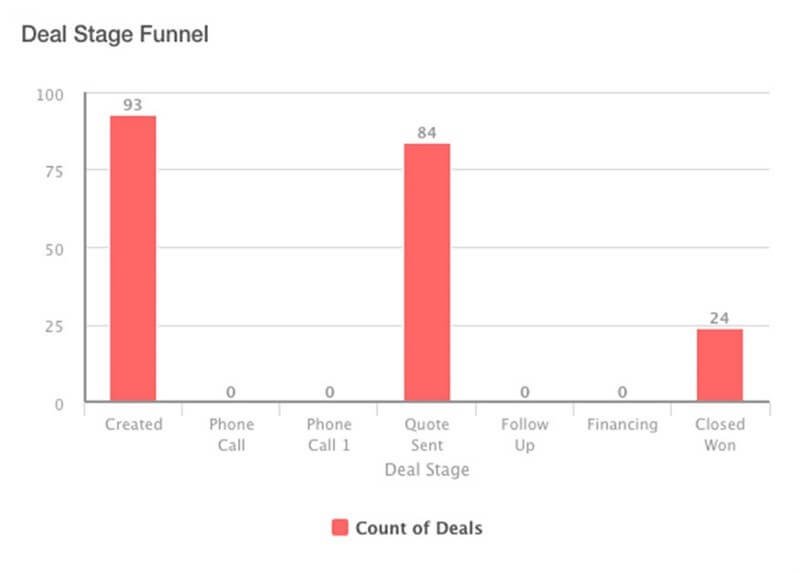
Deal Stage Funnel
The Deal Stage Funnel shows how many people are in the various stages of the sales process.

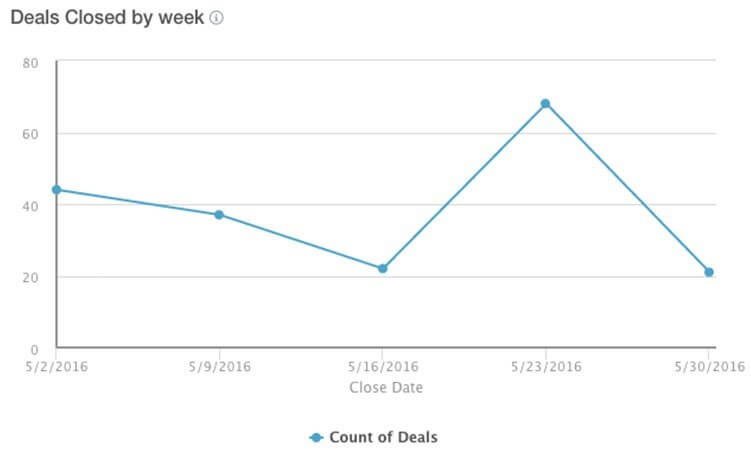
Deals Closed by Week
This chart provide an overview of how many deals are closing in a week’s time

Deal Revenue Leaderboard
This chart shows top employees based on number of closed deals, amount associate with those deals, and how long it took to close them.

Our clients who have invested in HubSpot’s CRM have access to the dashboard elements show above. This dashboard functions has our Marketing & Sales KPI Report.
There are other ways of gathering data and reporting on it, but why work harder when you can work smarter?
Did you find this post helpful? Sign up for our monthly e-blast then follow us on Facebook, Twitter, Instagram, and Pinterest!